In 1999, Frederic Vester published a report to the Club of Rome named “The Art of Interconnected Thinking”. The main focus of the book is about understanding complex systems, and how a number of interconnected models, what he called the Sensitivity Model, can help us do so. The Sensitivity Model is an IT-based approach, today in the ownership of Malik Management. While other IT-based approaches try to connect some 200+ variables into a database, Vester is frugal in comparison, with 10-20 variables. The advantage of his approach over the more mathematical siblings is the acceptance and use of fuzziness. We simply cannot expect to be able to get a total picture of our system with sharply differentiated concepts and mathematical variables, so stop trying to do it anyway. The consequence is: we better accept that whatever model we use, it will be incomplete and partially wrong. It would be foolish to attempt something that is 100% correct. Therefore, a more realistic ambition is to create a model which is relevant to the pragmatical perspective of the beholder, and is sufficiently apt to produce this relevance.
“The map is not the territory.”
— attr. Alfred Korbynszky
I have facilitated the creation of sensitivity models, and they still take a group at least a day to construct. With this in mind, I would like to propose something more pragmatical: something that you can do alone or in a small team, without external assistance, in less than half an hour if need be.
If we take a blank sheet of paper and try to visualise a complex system, most often we start writing down some elements of the system and connect them with lines. Often, these lines become arrows, and we end up with an influence map, or, as many call it, a spaghetti diagram. Unfortunately, just like spaghetti on a plate, the spaghetti diagram has a practical fault: in most cases, if we think about our system long enough, we end up with something like this:

Like Alice’s rabbit hole, it draws us in, and we can spend our time following the lines, but our most significant learning from this reverie is something we already know from the start: it’s complex.
In comparison to the spaghetti diagram, another model from Vester’s treasure chest, the role distribution map is less intuitive, but vastly more helpful from a pragmatical point of view. What is our interest in modelling our complex system? We want to learn more about how we can relate to the system and its various elements, what we can do with them. Can we use them as a leaver? What are the chances and risks of doing so? What are elements that we should watch with a careful eye? What are elements that we can happily ignore? In order to answer these questions, it makes sense to think about the role these elements play within the system.
A role distribution map is the visualisation of two questions: To what extent does an element influence the system, and to what extent is the element itself influenced by the system? Notice the fuzziness of the word “influence”: is it a specific cause-effect influence, or a diffused, unspecific force out of which something emerges? For the sake of this model, the answer to this question is of no importance. What is more important is the collection of essential elements, and the holistic assessment of their influence. With the answers to these two questions, we can place our essential elements on a role distribution map.
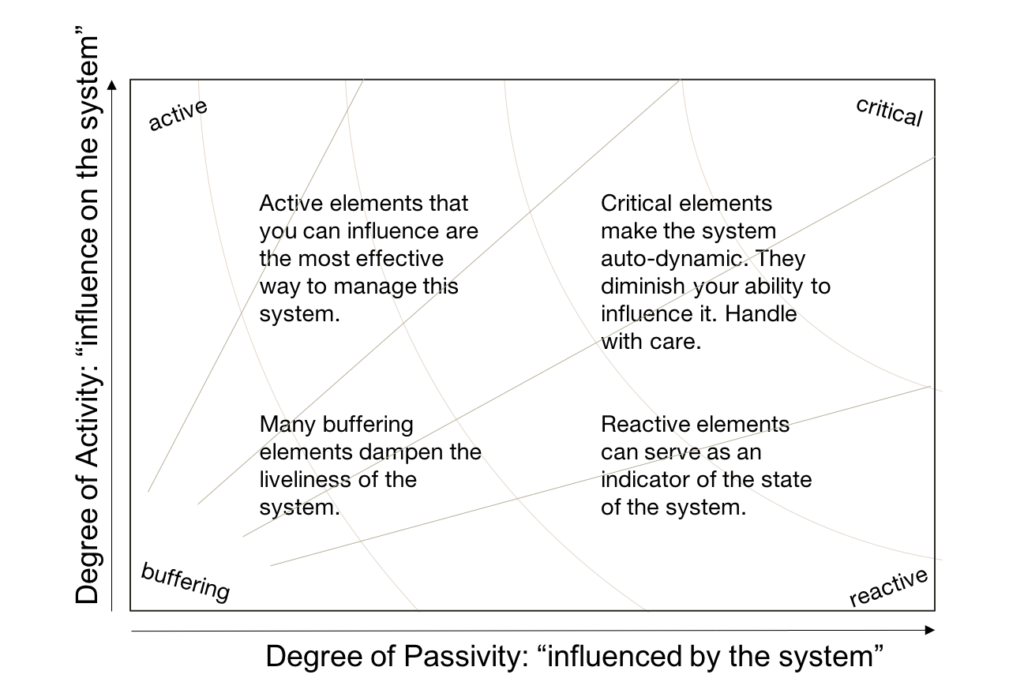
As a result of these reflections we have now identified elements which are a) critical factors of the auto-dynamic nature of the system, where external manipulation may easily trigger off surprising side-effects, b) reactive elements which may indicate the state of the system, but do not wield any power, c) buffering elements which contribute to the system’s stability, and d) active, i.e. relatively independent elements which actively influence the system. It is this last group which interests us most if we want to influence the system: If we can place a modulator on some of these elements, we have found the easiest way to make a difference.
This method, along with others, is part of the Palladio training program Beyond Bureaucracy: Navigating complexity with the Amber Compass. Click here for more information.